
Trafficity Traffic Metrics: Reading the Overlay
What the Trafficity traffic overlay actually shows, how to compare two versions of a junction fairly, and the four observations worth recording after a rebuild.
Trafficity does not give you a dashboard. There is no average commute time readout, no throughput counter, no graph of vehicles per minute. What the game gives you is a traffic overlay - a heat trail that shows where cars are slow or stopped - and the behaviour of the simulation itself. Reading it well is a skill, and it is the difference between fixing jams and moving them.
This page is about measurement discipline: what the overlay shows, what it does not, and how to compare two builds without fooling yourself.
The rush hour guide→ covers the demand side, and bottleneck diagnosis→ turns the numbers into a fix.
What the overlay shows
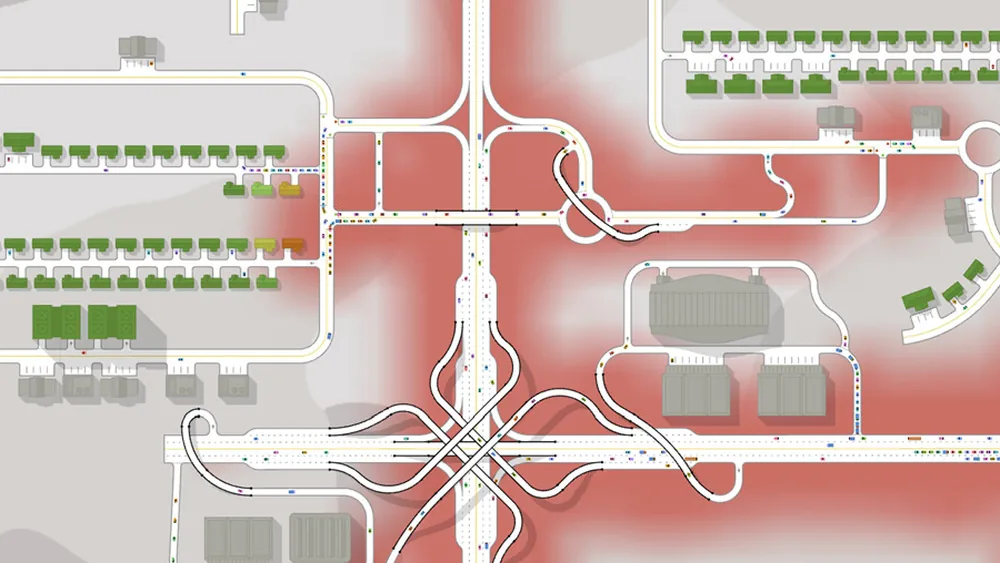
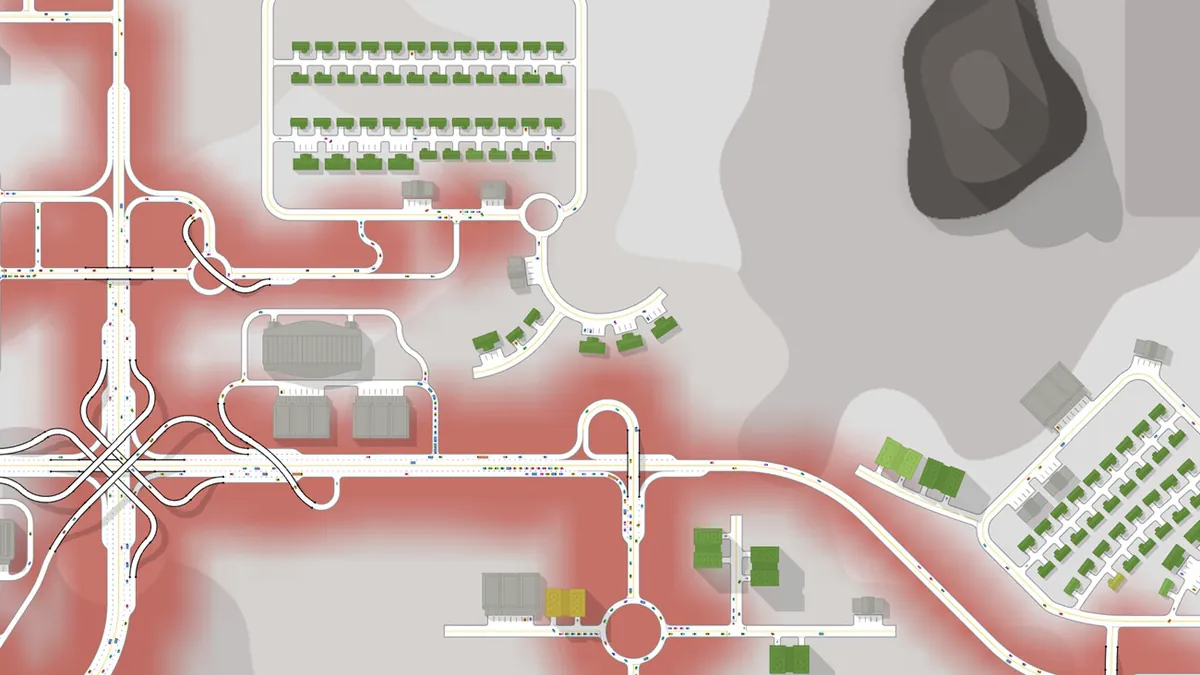
The overlay paints congestion onto the road network. Red marks the worst conditions, and the colour fades as traffic moves freely. It is a live snapshot, not an average, which is the single most important thing to understand about it.
Consequences:
- A red road at one moment may be clear a second later. Traffic arrives in batches, especially around shift changes.
- A red road that stays red across a full cycle is a structural problem. That is the signal worth acting on.
- The overlay does not tell you why. It shows where cars are slow, not whether the cause is capacity, a missing connection, a blocked exit or a phase that is too short.
Take a screenshot of the overlay at the worst moment of a rush hour. Comparing two screenshots of the same junction before and after a rebuild is far more reliable than trying to remember what it looked like.
A measurement protocol
Because the game does not normalise conditions for you, you have to do it yourself. A fair comparison between two builds needs four things held constant:
| Variable | Why it matters |
|---|---|
| City level | More level means more buildings and more trips |
| Biome | Terrain changes route options and district size |
| Difficulty | Expert changes money, not traffic, but it changes what you can build |
| Time of day | Rush hour and midday are different problems |
If you rebuild a junction and the city also gained a district in the same session, you cannot tell which change produced the result. Change one thing at a time, or accept that the comparison is anecdotal.
Four observations worth recording
You do not need a spreadsheet. Four observations per rebuild are enough to build a useful memory of what works on your map.
- Where the queue started. At the junction, or upstream of it?
- How far it reached. To the previous junction, or only partway down the block?
- Whether it cleared within the cycle. Fully, partly, or not at all?
- What it looked like immediately after the change. Better, worse, or moved somewhere else?
Those four answers tell you whether the rebuild addressed the constraint or just relocated the queue. A rebuild that moves the red to the next junction has not solved anything - it has revealed the next constraint, which is progress only if you keep going.
Throughput versus delay
Two junctions can look equally red and be failing in opposite ways.
Low throughput, low delay. Cars pass slowly but steadily. The junction is under capacity, and the queue clears. This is usually fine.
High throughput, high delay. Cars pass in bursts and then wait. The junction is at its limit, and the queue survives the cycle. This is the one that eventually blocks upstream junctions.
Low throughput, high delay. Cars barely move at all. That is a blockage - typically a missing connection or a blocked exit - not a capacity problem.
The distinction matters because the fixes are different. Widening helps the second case and does nothing for the third.
Junction behaviour can change between game versions. A build that measured well last week may behave differently after an update. Re-measure rather than trusting the old observation.
What the overlay cannot tell you
It cannot tell you why a building is unhappy, and it cannot tell you whether a district is growing. Those are service and zoning questions, covered in troubleshooting→. It also cannot tell you whether a car is taking a silly route - the route is the shortest one the network allows, and if it looks wrong, the network geometry is the reason.
Finally, the overlay does not distinguish between cars that are waiting at a red light and cars that are queueing behind a blockage. Both look red. The difference is that a signal queue clears when the phase changes, and a blockage queue does not.
Turning observations into decisions
The decision rule that follows from all this is simple:
- If the red clears within the cycle and the queue stays behind the previous junction, leave it alone.
- If the red survives the cycle, run the five-step diagnosis before spending money.
- If the red moves after a rebuild, you found the next constraint - repeat the diagnosis there.
That is the whole method. It is slower than rebuilding on sight, and it is the reason some cities keep working at level 30 while others need a rebuild every five levels.
Where the data comes from
- Trafficity on Steam ↗ - store description, price and feature list.
- Trafficity news hub ↗ - patch notes and developer posts.
- Steam global achievement percentages ↗ - the public endpoint behind the completion figures quoted here.
Official source: Trafficity on Steam ↗
FAQ
Does Trafficity show average commute time? The game exposes congestion through the overlay rather than a numeric commute readout. Comparisons have to be made visually under controlled conditions.
What do the overlay colours mean? Red marks slow or stopped traffic, fading toward normal road colour where traffic flows. It is a live snapshot, not an average.
How do I compare two layouts fairly? Keep city level, biome, difficulty and time of day constant, and compare screenshots taken at the worst moment of the same rush hour.
Why does the overlay change every second? Cars arrive in batches. Watch a full cycle before drawing conclusions.